Charts
Fund balance trends chart
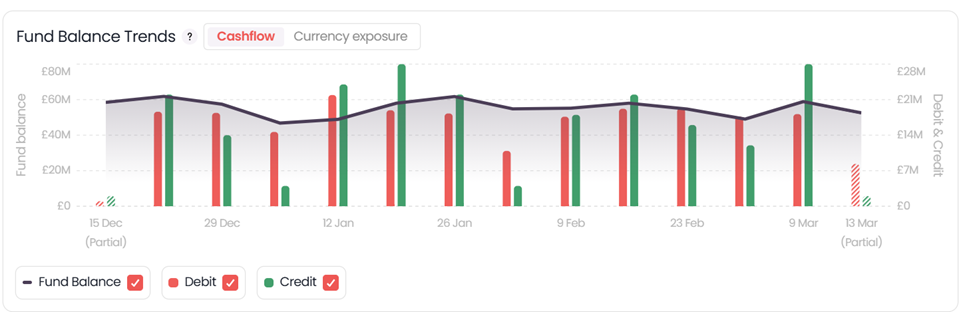
Cashflow view
The Cashflow view shows the Fund balance over your selected time period. You can include credit and debit activity for deeper insights by using the checkboxes below the chart.
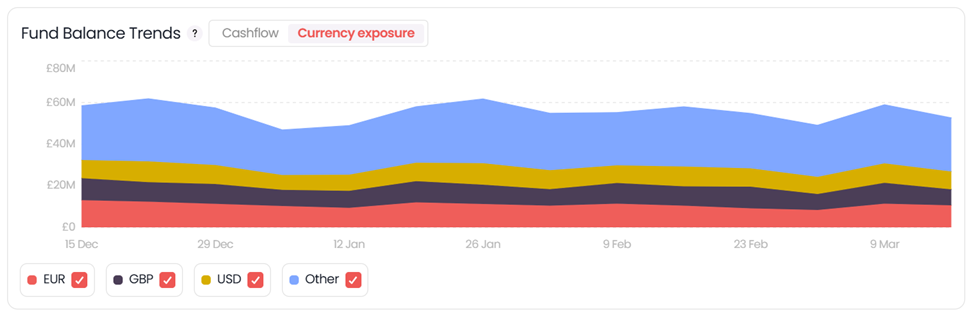
Currency exposure view
The Currency exposure view tracks funds in their currency over time. The top three currencies by total fund balance are displayed as individual segments, while all other currencies are grouped under "Other."
Fund allocation pie chart
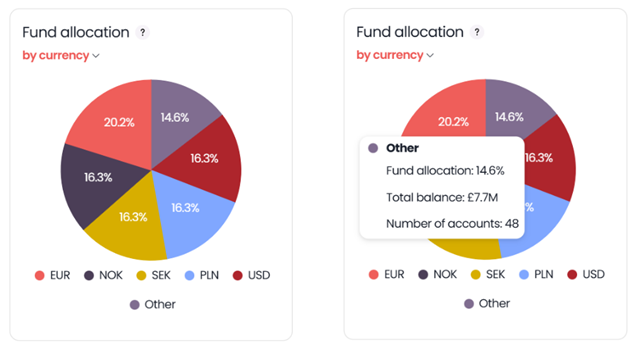
Currency view
The Currency view shows a percentage breakdown of your funds by currency in value. The top five currencies are displayed as individual segments, while all others are grouped under "Other." Hovering over each segment provides further detail on total balances and number of accounts.
Account type view
You can switch to the Account type view to see how funds are allocated across different account types:
- Standard (commonly referred to as Loss Fund account)
- Funding
- FCP (i.e. Funding accounts associated to eligible Lloyd's binders)
- ABM
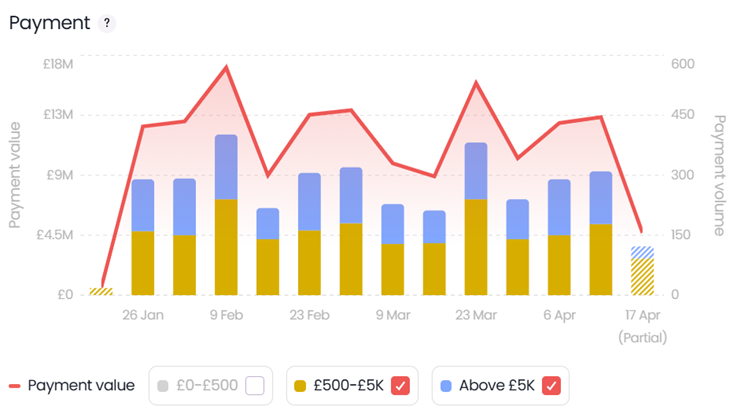
Payment chart
The Payment chart shows the payment activity over your selected time period and currency (filters) across all accounts. The line represents payment value over time, while the bars show payment volumes by payment size bands (below 500, above 5,000 and everything in between, in the selected Display currency).
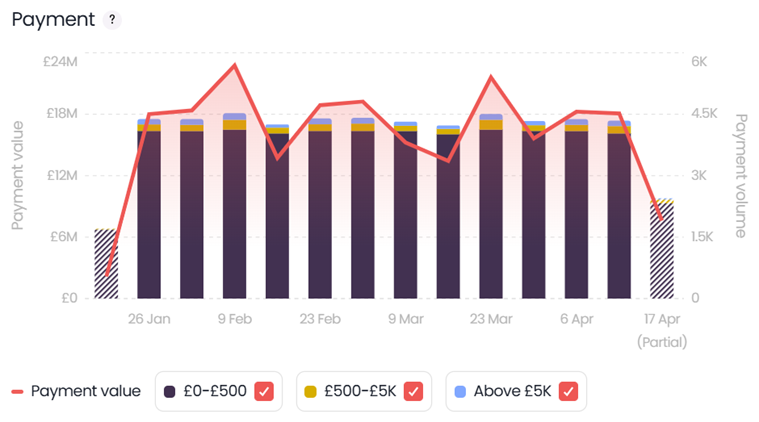
You can customise which payment bands are included on the chart using the checkboxes below. Adjusting the bands will automatically update both payment value and volumes.
For example, in the graph above, payments below 500 dominate, taking up most of the space. To focus on the other size bands, you may want to exclude them, as shown in the graph below.
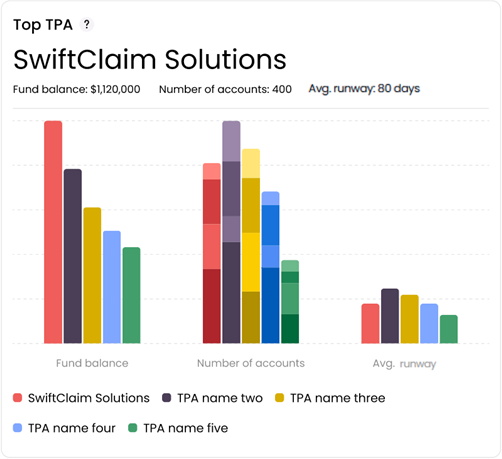
Top TPA chart
The Top TPA chart displays the top five TPAs, ranked by the total value of delegated funds. For each TPA, the following details are shown:
- Current fund balance
- Current number of accounts, split across different account types
- Average runway over the last three months across all standard account types
In the example below, "SwiftClaim Solutions" (fictitious) is shown to be the TPA with the largest fund balance.
Updated 2 months ago
Related information
Other pages related to the Treasury Insights Dashboard