Customising data display
Vitesse.io includes several controls that allow you to customise how data is displayed. You can apply filters, sort table columns, and switch display currencies to quickly find the information you need.
Not all controls are available on every page. Availability depends on the type of view you are using.
Display currency switch
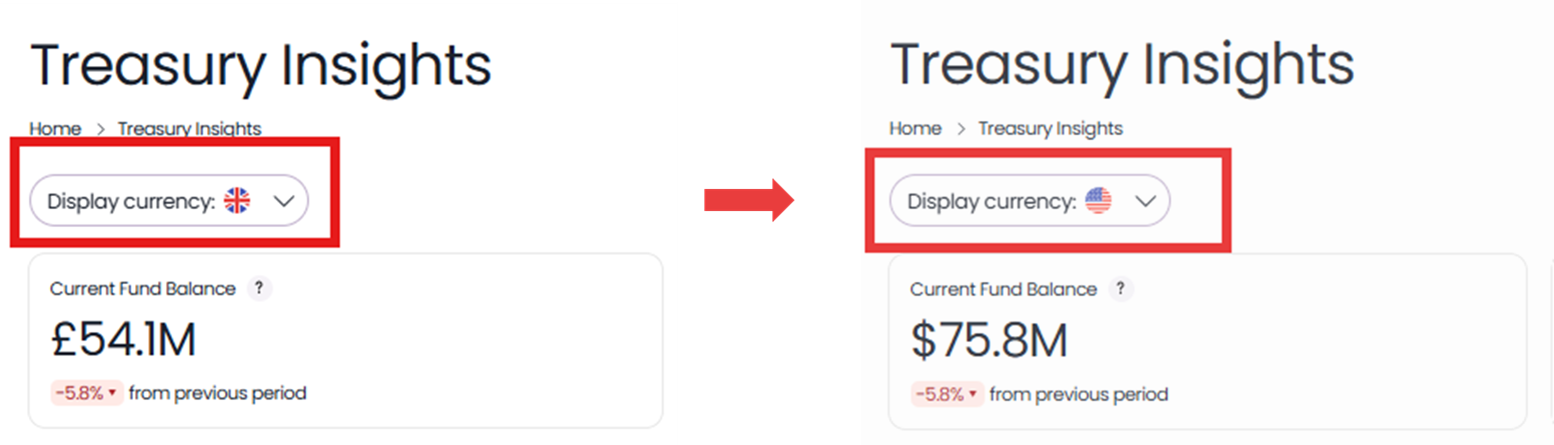
The Display currency switch allows you to toggle between GBP, EUR, and USD to view values converted into the selected currency. When the display currency is changed, the dashboard updates automatically.
The example below illustrates how the Fund Balance widget is affected by switching Display currency from GBP to USD:
Filters
Filters narrow down the data displayed in the dashboard. Simply select the desired filters from the menu and the data will update accordingly.
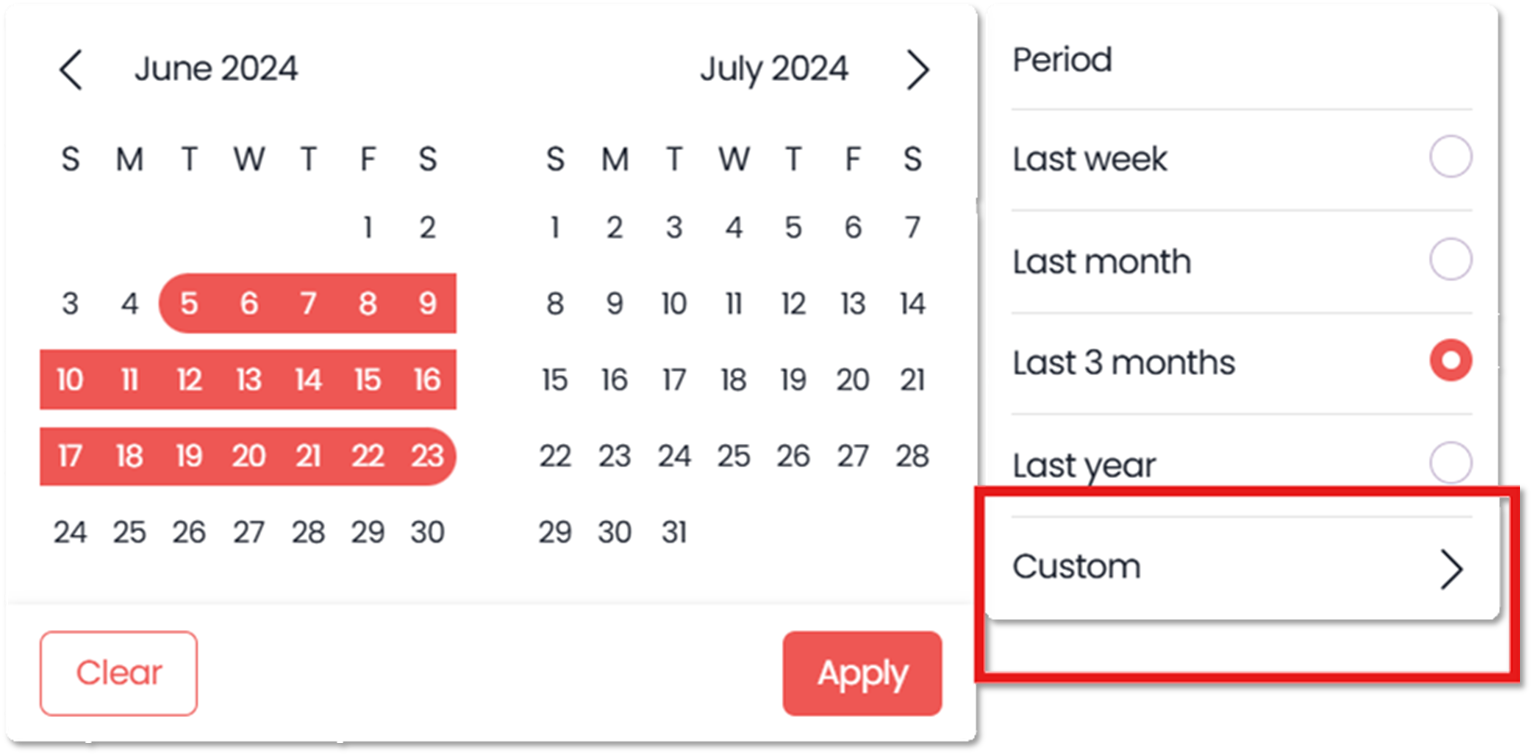
Time filter
Data can be filtered by the following time periods:
-
Last week
-
Last month
-
Last 3 months
-
Last year
-
Any Custom range, between a start date and an end date of your choice.
Note that some data updates based on the selected time period, while other data remains unchanged.
| Updated | Unchanged |
|---|---|
| Average payment value | Current fund balance value |
| Payment success rate percentage | Current number of accounts |
| Fund balance trends chart | Fund allocation pie chart |
| Payment activity chart | Top TPA chart |
| Runway table |
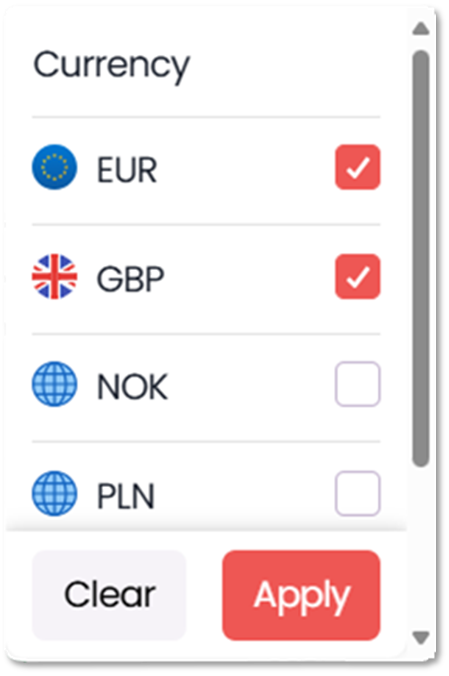
Currency filter
The currency filter lets you include/exclude specific currencies in your portfolio. When selecting one or multiple currencies, the dashboard will update to show data where the account and payment currency match selected currencies.
Column sorting
Some tables support column sorting.
Where available, select a column header to sort the table by that column. An arrow in the header indicates the current sort order (ascending or descending).
Select the header again to reverse the order.
Updated 18 days ago
Other pages related to the Treasury Insights Dashboard